How Is ROAS Calculated? The Formula, Inputs, and Where It Breaks Down
Meta reports a healthy ROAS. Google reports a healthy ROAS. Add up the revenue each one claims and the total can come out higher than what your Shopify store booked for the same month. Next month's budget is still due.
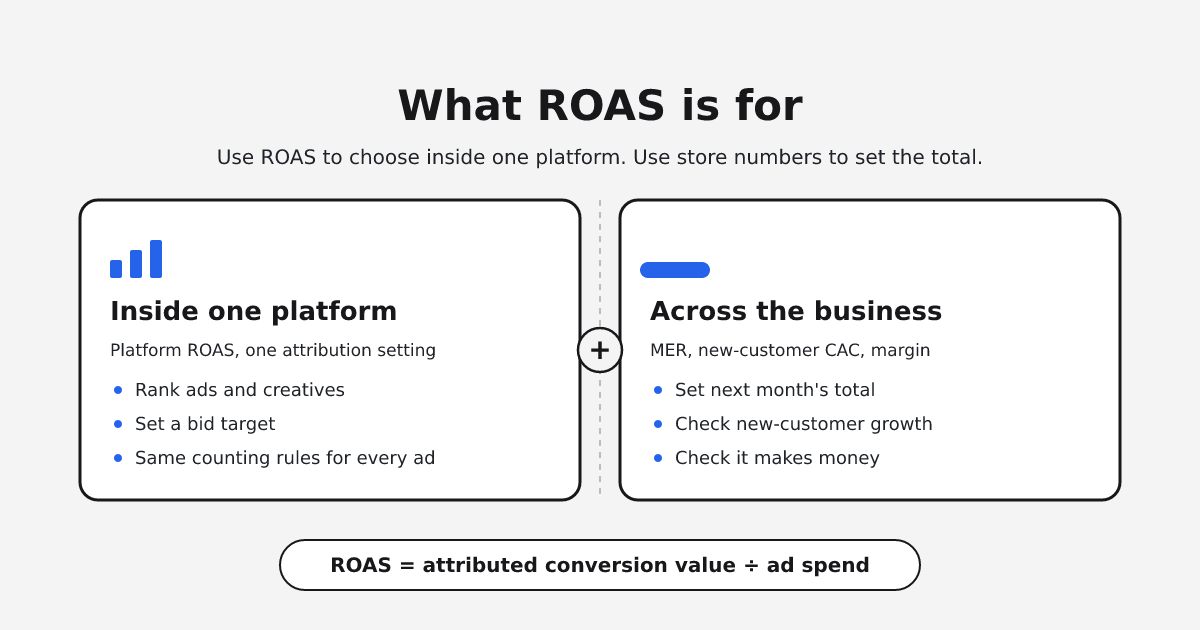
ROAS is attributed conversion value divided by ad spend. Each platform fills in the top of that fraction with the orders it claims, under its own attribution window and its own definition of a click. That makes ROAS a sound signal for comparing ads inside one platform at one attribution setting. It is a poor basis for splitting budget across channels, because platforms count the same order independently, the numerator is claimed value instead of settled orders, and the formula ignores margin and whether the buyer was new.
Keep ROAS for optimizing inside each platform. Make the budget decision with marketing efficiency ratio (MER), new-customer CAC, and margin.
TL;DR
- ROAS is attributed conversion value ÷ ad spend.
- The platform sets the numerator under its own window and click rules, so a rule change moves ROAS with no change in sales.
- Use ROAS to compare ads, ad sets, and creatives inside one platform at one attribution setting.
- Don't add ROAS across platforms or set the total budget with it.
- There is no universal good ROAS. Your breakeven ROAS is 1 ÷ margin.
How ROAS is calculated: the formula and its inputs
Google defines target ROAS as "the average conversion value (for example, revenue) you'd like to get for each dollar you spend on ads", with the example "$5 USD in sales ÷ $1 USD in ad spend x 100% = 500% target ROAS". Polar Analytics writes it as "ROAS = attributed conversion value / ad spend".
The numerator: attributed conversion value
This is the revenue the ad platform credits to its own ads. First, which revenue figure does your setup send? Shopify reports three. Gross sales is "product price x quantity (before taxes, shipping, discounts, and sales reversals)", net sales is "gross sales - discounts - sales reversals", and total sales adds "taxes + duties + shipping charges + fees". Check which figure your pixel or conversion integration passes as conversion value, and compare it with net sales. A value that carries tax and shipping, or that never subtracts a refund, raises ROAS without adding a dollar of margin.
Second, which conversions count? Under Google's consent mode, "Modeled conversions will appear in the 'Conversions' column" for users who did not consent. Apple requires that, in iOS 14.5 and later, apps "need to receive the user's permission through the App Tracking Transparency (ATT) framework in order to track them", and that covers advertising measurement. Part of a platform's numerator can be modeled, and part can be missing.
The denominator: ad spend
Spend can be media only or fully loaded with fees. Tinuiti notes that with choices like these, and windows from same-day to 30 days, "two platforms can report very different ROAS for the same outcome". Pick one definition of spend and keep it.
The attribution window and the click definition
In Google Ads, "The first click, linear, time decay, and position-based attribution models are no longer supported by Google." Last click and data-driven remain.
Meta made one reporting change in 2026 and announced a second. From January 12, 2026, Meta stopped returning 7-day view and 28-day view attribution windows in its reporting API, leaving 1-day click, 7-day click, 28-day click, 1-day engaged view, and 1-day view. On March 3, 2026, Meta announced that later that month it would change "the definition of click-through attribution for website and in-store conversions to exclusively include link clicks", moving shares and saves out of click-through credit into a separate engage-through count.
A Meta ROAS trend that runs across January 2026 at a 7-day or 28-day view setting, or across March 2026 for website or in-store conversions, compares numbers counted under different rules. Compare periods at the same setting.
A worked example
These numbers are illustrative. You spend $20,000 on Meta in a month, and Meta reports $60,000 in conversion value at a 7-day click setting. ROAS is $60,000 ÷ $20,000 = 3.0, or 300%.
Polar Analytics gives breakeven ROAS as 1 ÷ gross margin. At a 40% gross margin, breakeven is 1 ÷ 0.40 = 2.5, and 3.0 clears it. Subtract shipping, payment fees, and other per-order costs to get contribution margin. At 30%, breakeven is 1 ÷ 0.30 = 3.33, and the same campaign falls short.
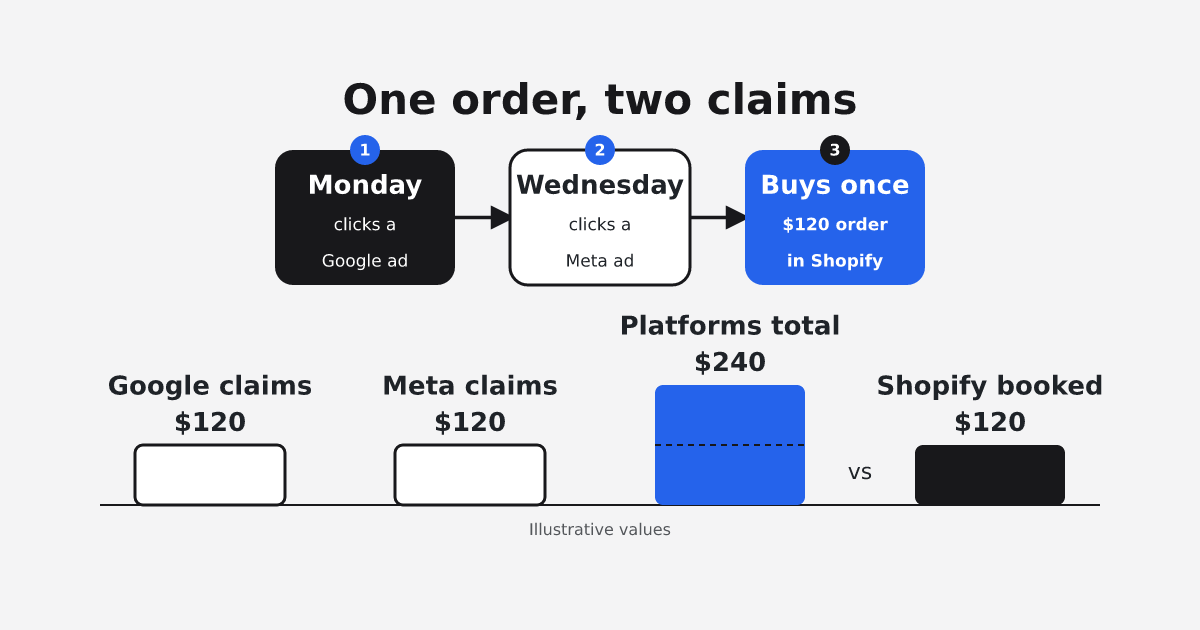
When one customer clicks a Google ad on Monday and a Meta ad on Wednesday, then spends $120, each platform can claim the order under its own rules. The two report $240 between them while Shopify books $120.
Where ROAS works
Inside one platform at one attribution setting, every ad is counted by the same rules. That makes ROAS useful for ranking ads against each other and for bidding. Google's Smart Bidding "will learn across all conversion actions reported in the 'Conversions' column", so target ROAS is the number the system optimizes toward. One Hacker News commenter describes ad buyers who "track which converts (attribution, which has flaws, but generally is decent signal), and allocate spend via return on ad spend."
Where ROAS breaks down
The trouble starts when ROAS leaves its platform. Adding across platforms counts orders more than once. Polar Analytics writes that if you "Sum the platform-reported revenue across channels and the total routinely exceeds your actual Shopify revenue, because the same order got counted two or three times", though it publishes no method for that claim. A practitioner reported on Hacker News in 2021, "I've had many transactions claimed by multiple advertising platforms." We found no published, measured study of how large the overlap is, so treat any fixed over-count figure with suspicion.
View-through credit tilts the comparison: Polar Analytics notes that "View-through ROAS flatters the channel that served the most impressions".
ROAS counts revenue and leaves out product cost, shipping, and fees, so the worked example's 3.0 clears breakeven at a 40% gross margin and falls short at a 30% contribution margin. The same 2021 commenter called ROAS "a poor metric because it has nothing to do with profit."
The formula also has no term for whether the buyer was new. Northbeam warns that "Blended ROAS can look great even when most sales are from existing customers, hiding weak acquisition". We made the wider case against running growth on platform ROAS in The ROAS Mirage: Why Platform ROAS Is Not a Growth Strategy.
The case for keeping ROAS
ROAS is simple, Google and Meta both report it, and Google's bidding learns from it. Google says its consent-mode models are "aiming to minimize over-prediction. As a result, some conversions that in reality occurred may not be accounted for", so not every platform figure runs high. Tinuiti still lists ROAS for "Comparing efficiency across channels" and "Guiding short-term budget allocation." And MER has its own gap. Prescient AI asks, "When your MER drops from 4.0 to 3.5, what action should you take?"
Your agency's objection is practical: everything is set up to optimize to ROAS, and changing the metric means changing everything.
That objection assumes ROAS has to do every job. Wayflyer describes MER as a company-wide measure and ROAS as a campaign-level one. Your agency keeps optimizing on ROAS; you change only the numbers that set the total. When MER drops, campaign ROAS at a fixed setting is where you look for the cause.
When to use ROAS, and when to use MER, new-customer CAC, or margin
| Decision | Metric | Why |
|---|---|---|
| Which ad, ad set, or creative to scale inside one platform | Platform ROAS at one fixed attribution setting | Every ad is counted by the same rules |
| What target to give a bidding strategy | Target ROAS set above your breakeven | Smart Bidding learns from the Conversions column |
| How much to spend in total next month | MER: net sales ÷ ad spend | Shopify counts each order once |
| Whether spend is buying new customers | New-customer CAC: ad spend ÷ new-customer orders | ROAS has no term for new versus returning buyers |
| Whether the spend makes money | Breakeven at 1 ÷ margin, or profit on ad spend (POAS) | Margin decides profit |
Check the gap in your own account
- Pull last month's net sales from your Shopify sales report.
- Export conversion value and spend from each ad platform, and note the attribution setting each uses.
- Add up the platform-claimed conversion value. Amounts above Shopify net sales can come from orders claimed more than once, from a revenue figure that carries tax, shipping, or refunded orders, or from modeled conversions.
- Divide net sales by total ad spend to get MER.
- Divide total ad spend by new-customer orders to get new-customer CAC.
- Repeat monthly at the same settings.
Where Consequential fits
Every step in that check depends on matching platform claims to real orders. Consequential, a revenue intelligence and ad decision platform for DTC ecommerce brands, starts there: every platform-claimed conversion is checked against orders that actually settled in Shopify. On that base, the acquisition dashboard shows revenue, orders, ROAS, CPA, and CVR twice, as the ad platform reports them and as Consequential attributes them, with new and returning customers split out and a match rate for each ad provider.
NorthStar (revenue intelligence) tracks MER and new-customer CAC against your targets. Its sample report shows "Blended MER" and "New-customer CAC" and "puts the gap and what caused it in your inbox at 8am".
Before: two healthy-looking platform dashboards and a Shopify total that disagrees with both. After: both versions of ROAS side by side, and a budget set by MER and new-customer CAC against target.
The limit: Consequential-attributed figures are "computed under your selected attribution model, not the platform's own methodology", so they change when you change the model. Reconciliation shows which claimed orders settled. It does not prove the ad caused the order.
FAQ
What is a good ROAS?
No single number fits every brand. Your breakeven ROAS is 1 ÷ margin: 2.5 at a 40% gross margin, 3.33 at a 30% contribution margin. A campaign's ROAS is good when it clears that line at the attribution setting you report.
Is MER a helpful metric?
Yes, for the total. MER divides store sales by all ad spend, so each order counts once, and Wayflyer gives its breakeven as "break-even MER = selling price / gross profit". MER cannot tell you which campaign to change, so pair it with campaign ROAS.
Why do Meta and Shopify revenue never match?
Meta reports the value it claims under its own window and click rules; Shopify records the orders that settled. Use Shopify net sales for totals and Meta's numbers for comparing Meta ads with each other.
Before you rework the budget, check your tracking. UTM Health (Shopify tracking audit) scores your campaign tracking from 0 to 100 across coverage, completeness, naming, and attribution, and shows how much revenue arrived with no source attached. The UTM Health page says parameter tracking is read "from the order and customer journey data Shopify already holds", so you install no pixel. The audit and the score are free and unlimited; detailed reports are $25 per run. Install UTM Health from the Shopify App Store and run your free audit.