What Is a Good ROAS for a DTC Brand? Benchmarks and Why They Mislead
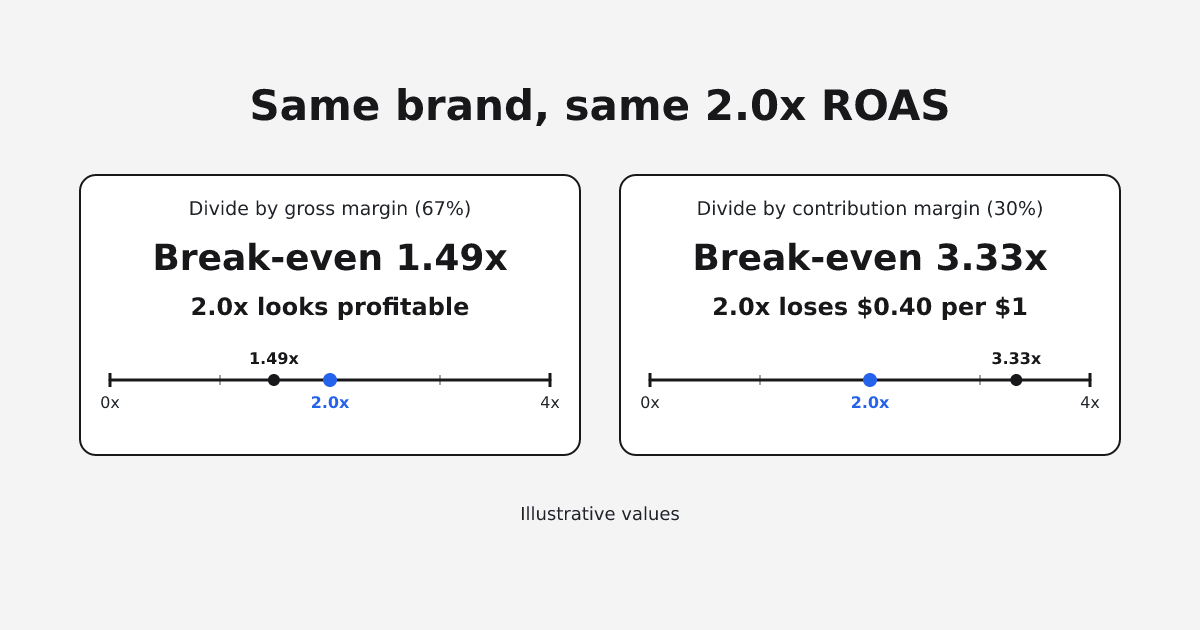
The margin you divide by sets the floor. Illustrative values.
Blended revenue is flat, or profit is shrinking, and every ad dashboard still shows a healthy ROAS. Meta and Google each report their own number, and either can disagree with what Shopify booked. One merchant described it in the Shopify Community in February 2024: "I'm running ads to my store via Facebook/IG ads and Facebook shows I have 15+ sales but I see no where in Shopify reports any..." Two later replies in that thread report the same problem.
A published ROAS benchmark cannot be your target. It is a median of other brands' numbers, built on their margins, and the sources rarely say whether the figure is what the ad platform reported. Your floor is break-even ROAS, which is 1 ÷ your contribution margin, and you test it against new-customer revenue from orders that settled in Shopify. Platform ROAS is, at most, a signal for comparing campaigns inside one platform.
TL;DR
- Published 2025 medians put Meta ROAS at roughly 1.9x to 2.2x and Google Ads at roughly 3.3x to 3.7x (Triple Whale, Varos). They describe other brands, and the page that quotes them does not say whether the figures are platform-reported.
- Break-even ROAS is 1 ÷ contribution margin. Gross margin is the wrong denominator because it leaves out shipping, payment fees, returns and discounts, so it sets the bar too low.
- Field experiments at Facebook and at eBay found that observational and non-experimental estimates usually overstated what ads caused. None of the sources we found gives a method-backed figure for how far platform dashboards overstate, so measure your own gap.
- Sum what Meta and Google claim for one month, compare it with revenue from settled Shopify orders, then split new from returning customers. Judge acquisition spend on new-customer ROAS against your break-even.
- Platform ROAS works for comparing campaigns inside one platform in one period. Meta's 2026 attribution changes can make an account's ROAS incomparable with its own history.
What the published ROAS benchmarks say
Two medians the benchmark pages quote come from Triple Whale and Varos. We could not open Triple Whale's own pages, so the figures below are as quoted by Superscale in July 2026, with the sample and window each dataset reports.
| Dataset | Platform | Median ROAS | Sample | Window |
|---|---|---|---|---|
| Triple Whale | Meta | 1.86x | Nearly 35,000 ecommerce brands | Jan-Dec 2025 |
| Varos | Meta | 2.19x | 28 industries | April 2025 |
| Triple Whale | Google Ads | 3.68x | 18,000+ ecommerce brands | Jan-Dec 2025 |
| Varos | Google Ads | 3.31x | 28 industries | April 2025 |
Both datasets put Google above Meta, and the two disagree with each other on the same platform. Superscale does not say whether Triple Whale's ROAS is platform-reported or Triple Whale-attributed.
Category tables add more ranges and less method. One benchmark page opens with "There's no universal 'good ROAS', what's healthy depends on your contribution margin, AOV, and customer lifetime value." Its ranges, updated May 2, 2026, put apparel and footwear at "1.8–3.0× MER, 2.5–4× platform ROAS", drawn from "public DTC reports (Shopify, Klaviyo, Triple Whale aggregates)" plus founder conversations, with no sample size. That one row mixes two metrics: platform ROAS divides what one platform claims by that platform's spend, while MER divides net sales by ad spend across all channels. Another page's "average ROAS for ecommerce" figure has no stated source, dataset, sample or method, so we leave it out.
What the medians do not show
A median leaves out four things a budget needs.
- Margin. A brand with a 40% contribution margin and a brand with 25% can post the same ROAS while one makes money and the other loses it.
- Measurement basis. A platform-reported median and a reconciled median are different numbers with the same label.
- Spend mix. eSellSphere's June 2026 tables, which give no sample or method, put Meta "Prospecting 2.5:1 to 5:1" against "Retargeting 8:1 to 15:1", and say "The incremental value of brand search ads is near zero for most ecommerce stores." An account heavy in retargeting and brand search can post a high ROAS from buyers who were already coming.
- Customer type. A median does not separate first orders from repeat orders, and repeat orders lift ROAS without adding customers.
Your break-even ROAS comes from contribution margin
eightx gives it as "1 divided by your contribution margin", where contribution margin is revenue minus COGS, shipping, payment fees, returns and discounts, before fixed overhead and before ad spend. Its worked example: "At 25% contribution margin, break-even ROAS = 4.0x." Consequential's docs use the same arithmetic: "At 30% CM, channels must generate 3.33x or more incremental ROAS to be profitable. At 40% CM, the threshold drops to 2.5x."
Every value in this illustrative brand's table is made up; replace each with your own from finance.
| Line, per $100 of order revenue | Illustrative value |
|---|---|
| Order revenue | $100 |
| Discounts | −$7 |
| COGS | −$33 |
| Shipping | −$10 |
| Payment fees | −$3 |
| Returns | −$17 |
| Contribution | $30, a 30% contribution margin |
| Break-even ROAS | 1 ÷ 0.30 = 3.33x |
Two benchmark pages divide by gross margin instead, as "Break-Even ROAS = 1 / Gross Profit Margin" and "Minimum Viable ROAS = 1 / Gross Margin %". For the same illustrative brand, gross margin is ($100 − $33) ÷ $100 = 67%, which gives a break-even of 1.49x. With that number, a 2.0x ROAS looks profitable. On contribution margin, each $1 of spend at 2.0x brings $2 of revenue and $0.60 of contribution, so the brand loses $0.40 on every dollar. Make sure the margin you use does not already subtract ad spend, which eightx also warns about.
If you do not have a contribution margin yet, Consequential's docs suggest a default of "30%" for general ecommerce within a "25–40%" range, noting "All ranges use benchmarks from DTC brands with annual revenue under $50M (2024–2025 data)." Treat that as a placeholder.
Break-even is the floor. To set a target above it, start from POAS, defined as "(Net Sales × Contribution Margin % − Effective Ad Spend) / Effective Ad Spend". Rearranged, target ROAS = (1 + target POAS) ÷ contribution margin. If the illustrative brand wants $0.20 of contribution left over per $1 of spend, its target is 1.2 ÷ 0.30 = 4.0x.
Why platform ROAS tends to sit above what ads caused
Each platform counts the orders it can claim, and the claims overlap. Shopify's help center says "in cases where a customer clicks on both your email and your Google Shopping ad they can each record a separate conversion," while Shopify's own report credits the sale to the most recent click within 30 days, using "Last non-direct click" by default. Platforms also count views. Google Ads counts conversions after a view by default, with a click-through window where "the default window is 30 days" and a view-through window where "the default window is 1 day".
Meta now offers a separate incremental attribution setting that "optimizes delivery for incremental conversions using models that predict whether a conversion is caused by an ad," according to Social Media Today in September 2025.
The experimental evidence points the same way. In 15 U.S. advertising experiments at Facebook run in 2015, published in Marketing Science in 2019, "the observational methods overestimate ad effectiveness relative to the RCT [randomized controlled trial], although in some cases they significantly underestimate effectiveness." That study tested observational models rather than platform dashboards. In eBay's paid search experiments (NBER working paper 20171, one advertiser), "returns from paid search are a fraction of conventional non-experimental estimates" and "brand-keyword ads have no measurable short-term benefits."
Returning customers widen the gap. In the same eBay study, for non-brand keywords, "more frequent users whose purchasing behavior is not influenced by ads account for most of the advertising expenses." ATTN Agency reports "Average blended ROAS: 3-5x, Average new customer ROAS: 1.2-2.5x" from its own client work, with no sample or method. Our post The ROAS Mirage covers how returning buyers and organic demand hide flat acquisition, and Your Ad Algorithm Is Optimizing Against You covers what that blended signal does to bidding.
None of the sources we found gives a method-backed figure for how far platform dashboards overstate. Polar Analytics says "30–50% inflation is common." Hawky argues the opposite: "your real ROAS is likely 20-30% higher than what your ad dashboard shows." Neither publishes a method, so measure the size of the gap for your own store.
Check how far your platform ROAS sits from your orders
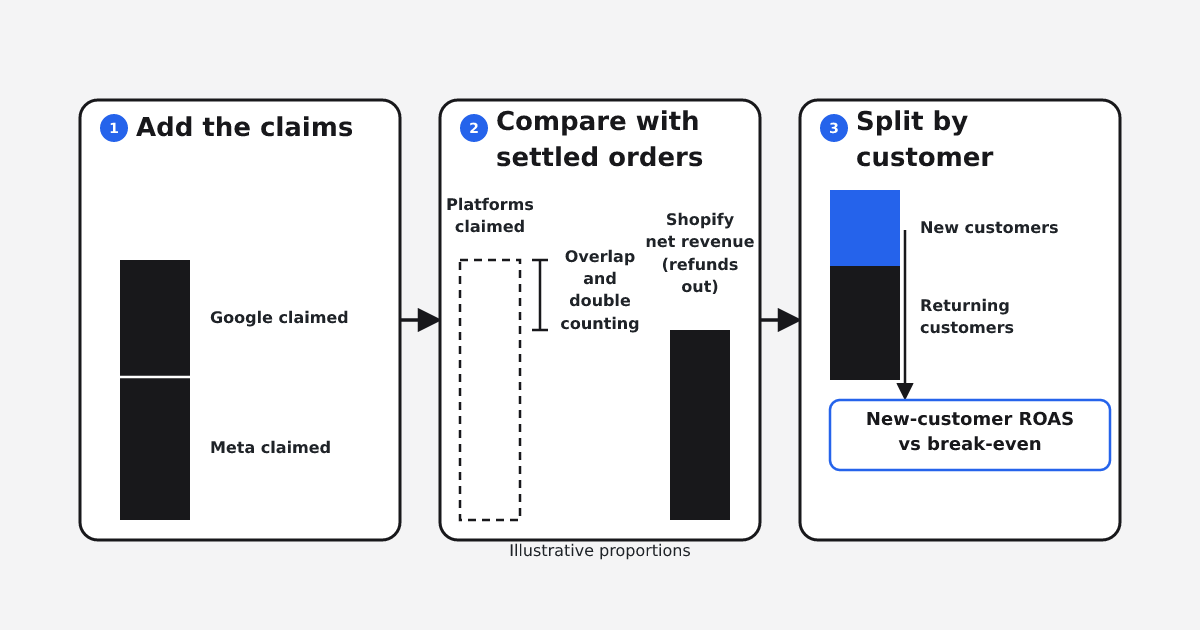
The store check in three steps. Illustrative proportions.
- Pick one full calendar month that ended long enough ago for most refunds and returns to have cleared.
- Export spend and platform-claimed conversion value for that month from Meta and from Google Ads. Write down the attribution window each account used, because the totals depend on it.
- Add the two claimed-revenue figures together.
- Export Shopify orders for the same month. Leave out draft and manual orders, subtract refunds, and total the net revenue.
- Divide total claimed revenue by Shopify net revenue. A ratio above 1 means the platforms claim more revenue than the store took in from every channel combined, organic and email included.
- Split the Shopify orders into new customers (first order ever) and returning customers, and total the revenue for each group.
- Calculate new-customer ROAS, defined by Northbeam as "new customer revenue divided by spend", and NC-CAC, defined as "Total Ad Spend / New Customer Orders". Compare new-customer ROAS with your break-even ROAS.
A ratio below 1 does not clear the platforms: they can still claim orders that would have arrived through email, organic search or a returning customer's bookmark. The comparison that matters for acquisition is step 7. If new-customer ROAS sits below break-even while blended ROAS sits above it, your blended ROAS is being carried by returning customers, and acquisition spend is not paying back on first orders.
The check has limits. It measures how much the platforms claim against what settled; it does not measure what the ads caused. Some returning orders are driven by ads too. Run it monthly with the same windows, and log any platform setting changes.
The case for platform ROAS, and where it breaks
The strongest objection to all of this is that the absolute number does not matter for daily work. You compare campaign A with campaign B inside Meta, both counted the same way, and move budget toward the better one. Measured, which sells incrementality measurement, recommends teams "use ROAS as an operational metric and incrementality as a strategic one." The Facebook study also found that observational methods sometimes underestimate, so assuming a fixed inflation factor would be its own error.
That holds for comparisons within one platform in one period, and it breaks when you compare an account with its own history. From January 12, 2026, Meta stopped reporting 7-day and 28-day view-through windows in its Ads Insights API, according to a Meta developer post from October 2025. In 2026 Meta also redefined click-through attribution for website and in-store conversions to "exclusively include link clicks", moving shares and saves into "engage-through attribution". A campaign's ROAS this quarter and the same campaign's ROAS a year ago may count different things. Settled Shopify orders were not part of these Meta changes, which is why they make the steadier reference.
"Our agency reports ROAS weekly and we're growing"
Keep the weekly report; platform ROAS is a reasonable signal for the agency's in-platform decisions. Add two lines to it: new-customer ROAS against your break-even, and NC-CAC, both from settled orders. If those hold while spend grows, new customers are paying back on their first orders. If blended revenue is flat while reported ROAS stays healthy, the reported number is not showing new demand.
A weekly report shows what happened, and the agency acts on it. Check whether anyone on your side owns the next change: sets the number it should hit and checks afterwards whether it did.
Where Consequential fits
Consequential is a revenue intelligence and ad decision platform for DTC ecommerce brands, and reconciliation is the base under it. Consequential matches Shopify orders to ad campaigns by campaign ID or UTM. It keeps unmatched orders so it can compute the match rate, and it excludes draft and manual orders so they cannot inflate paid ads.
The Acquisition Dashboard shows "Revenue, orders, ROAS, CPA, CVR" in "two forms: what the ad platform itself reports, and what Consequential attributes based on your selected attribution model". With order-side attribution on, it splits ROAS by new and returning customers, and it shows a "Match rate": "the share of orders each ad provider was able to match back to its own click or view data." It keeps a new and returning split of attributed orders current.
NorthStar (revenue intelligence) reconciles platform-claimed conversions "line-by-line against orders" and tracks the targets you commit to. You can set a target on a rate metric such as ROAS, for example at your break-even, and get an alert when it falls off pace. AdBuyer (ad spend decisions) produces budget proposals "Computed on actual orders from your own pixel, not the platform's report card."
Before, each platform reports its own ROAS and someone on your team holds the totals together. After, the platform-reported and reconciled numbers sit side by side, split by new and returning customers. The limits: "AdBuyer does not have write access to your ad accounts. Today it recommends and you act." Incrementality can be measured with holdout tests (withholding ads from a random group), like the Facebook experiments, or geo-lift tests (turning ads off in some regions), like eBay's. Consequential does not run holdout, geo-lift or PSA tests; AdBuyer estimates incrementality from new-customer metrics, proxies and causal inference.
Matching depends on campaign IDs and UTMs, so broken tags leave orders unmatched. UTM Health (Shopify tracking audit) checks them first: "The audit and the score are free and unlimited", it returns "Your UTM Health Score, 0 to 100", and it needs "No pixel, no tag manager, no ad account connection". "Detailed reports are $25 per run and applied fixes are $1 each."
FAQ
Is a 2x ROAS good?
It depends on your contribution margin. Break-even ROAS is 1 ÷ contribution margin, so a 2x ROAS breaks even only at a 50% contribution margin. At a 30% contribution margin, break-even is 3.33x, and a 2x ROAS loses money on every dollar of spend.
What ROAS do I need if my margin is 30 percent?
If 30% is your contribution margin, after COGS, shipping, payment fees, returns and discounts, break-even ROAS is 1 ÷ 0.30 = 3.33x. If 30% is your gross margin, your contribution margin is lower and your break-even is higher than 3.33x.
Should I scale a campaign that has 6x ROAS?
eSellSphere's benchmark tables put retargeting and brand search far above prospecting, and eBay's experiments found "brand-keyword ads have no measurable short-term benefits." Look at its new-customer ROAS against your break-even before adding budget.
Clean tracking comes before any of these numbers. Start the free UTM Health audit on the Shopify App Store to see which orders, and how much revenue, arrived with missing or broken UTM parameters.